Storm chasing requires constant and accurate weather nowcasting. Nowcasting is the practice of describing current weather conditions and those immediately expected. Unlike a forecast that attempts to predict future conditions, nowcasting is observing what is currently happening. This can be based on eye witness observations or through remote sensing.
Remote sensing is collecting real-time information about the Earth via a remote source. That source, as it relates to meteorology, is most usually either weather radar, weather satellite or a weather station.
With today’s wireless technology, we have the ability to collect remote sensing data while we are in motion. It used to be necessary to stop in order to use an available WiFi signal. Before WiFi, we had to stop and use a payphone to call a designated nowcaster during our tours. This designated nowcaster had access to real-time remote sensing observations, such as satellite imagery.
Let’s discuss some of the nowcasting technology and tools that we use during our storm chasing tours.
NEXRAD WSR-88D Doppler Radar
The USA has the largest weather surveillance radar network in the world. The National Weather Service operates 159 high-resolution S-band Doppler weather radars across the USA.
The National Weather Service’s current radar infrastructure covers about 98 percent of the continental United States. Originally created in the 1950s from WWII technology, the current network is the most advanced in the world.
Today, our radar network has “Super Resolution” and is dual-polarized. Dual-polarimetric radar transmits and receives pulses in both a horizontal and vertical orientation. As a result, the returning frequencies provide measurements of the horizontal and vertical dimensions of targets. These data supply forecasters with better estimates of the size, shape, and variety of targets.
We use software designed to take advantage of the super-resolution of today’s modern radars while conducting our storm chasing tours. We have also written a short article discussing the storm chasing technology we use.
Nowcasting Data Used When Storm Chasing
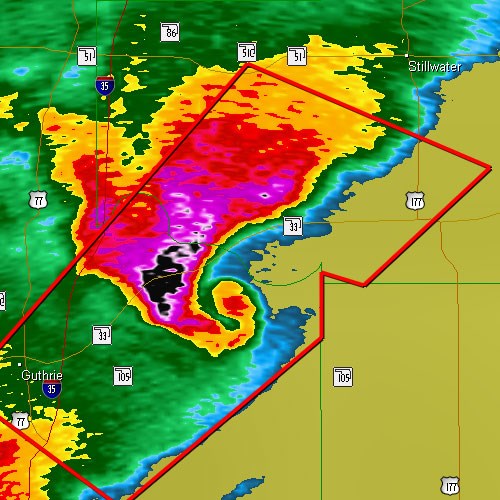
The National Weather Service provides two data feeds called Level 2 and Level 3 data. Both are acceptable for storm chasing. However, Level 2 Data has a much higher resolution than Level 3 Data. The disadvantage of Level 2 data is that, since it’s higher resolution, it’s also a bigger data file. Thus, it takes a little longer to get from the radar to the end-user. In rural areas with limited cellular capacity, these larger files may not download properly during times of high activity.
We use both types of data feeds while storm chasing. Either at the same time or at different times, depending on the conditions. Level 3 data provides us with an almost real-time image from the output of the actual radar. Depending on cellular conditions, it may take a minute or two longer for the Level 2 data to download.
When we need to know immediately what the radar is sensing, we’ll be using Level 3 data. However, most of the time we’ll use Level 2 data for its super-resolution ability. It’s likely we’re already near the storm and have visual observations, which are more useful than radar anyway.
However, radar does provide us with useful information while we’re operating within a storm’s environment. Such information can show us hail cores or velocity couplets within a rain core that may be difficult to see.
Visible and Infrared Satellite Imagery
One of the most useful tools available to nowcasters is satellite imagery. Weather satellites have many remote sensing instruments. These allow forecasters to observe Earth’s atmosphere through different wavelengths in near real-time.
The most useful wavelength is visible light (essentially, it’s a video camera in orbit). Using satellite imagery, we can identify various boundaries, such as cold fronts or outflow boundaries. Identifying the location of these boundaries can be mission-critical when storm chasing.
Weather stations consisting of a temperature, humidity, and wind sensors provide us with data used for nowcasting and forecasting purposes. We are constantly looking at surface maps showing these data. Customers will often ask us something like, “What do all those little numbers and pointy things mean?” So, let’s talk about it for a minute.
Surface Observations
Each plot, called a station model, contains a lot of information that is important to us. First, the most important piece of information on any weather map or chart is the time! It’s an easy piece of information to overlook. It’s best to just get into the habit of looking at the timestamp first to make sure it’s current.
On the left side of the plot are two very important numbers. The top number is the air temperature (T), and the bottom number is the dewpoint temperature (Td). Depending on the locale, these numbers may be in either Celsius or Fahrenheit.
The correct way to read this info is to say the temperature is over the dewpoint. For example, reading the current conditions at this station, one would say its 57 over 56. This simply means it is 57 degrees (F) with a dewpoint temperature of 56 degrees (F).
Either between these two numbers or in their immediate vicinity there might be a weather symbol. These symbols indicate such things as fog, snow, rain, thunderstorms and many other weather-related events. Pertaining to storm chasing, they’re really not that important. It’s much more important to know the (T) and the (Td) along with the wind information.
Understanding the Wind
The arrow describes wind direction and wind speed of observed near-surface winds. Anemometer height is 30-feet above the ground.
In the plot here, the wind is blowing from the north to the south. It is easiest to remember the wind direction by thinking of a typical “arrow” fired from a bow. The back of the arrow has feathers and the back of a station plot has wind barbs. The arrow travels in the direction of the arrowhead and the wind travels in the direction of the wind arrow.
A short barb is a 5-knot wind, a long barb is a 10-knot wind. So, in the plot here, the wind speed is 15 knots. A station model may contain other useful data, not shown here. Such data includes wind gusts. The letter “G” immediately preceding a number indicates wind gusts. For example, G23 would indicate that a 23-knot wind gust was observed.
Also on the plot to the right is atmospheric pressure. On charts containing a large number of station models, only a percentage will contain a sea-level pressure observation. This helps create clarity of the data presented on the map. Forecasters will often use pencils to connect lines of pressure, which helps identify areas of interest while performing a mesoanalysis.
Summary
These are the main nowcasting tools that we use while storm chasing. We acquire data from a variety of different sources, much of it being available to the public.
We also maintain our own private weather server. This server ingests weather data 24/7/365 and processes only data that is most useful to us for our specific needs.
However, there are a lot of websites that provide satellite imagery and weather station plots. Feel free to dive in and learn as much as possible. If you’re looking for the best phone app for weather radar data, we recommend RadarScope. It is available for all iOS devices as well as Android, and there is a Mac Desktop version as well.
To continue your learning experience, sign-up for a storm chasing tour on our tour schedule. The very best classroom is typically a rural road while directly observing nature’s most awe-inspiring atmospheric phenomena.