
Severe weather forecasting involves a large part of interpreting various parameters that indicate the level of instability in the atmosphere. Forecasters use a special diagram called a “Skew-T Diagram” that plots various parameters such as temperature and dewpoint as a series of curved lines on a Skew-T diagram. It is called the Skew-T diagram because the temperature lines are plotted as a “skewed” line running from the bottom of the diagram diagonally up and right towards the left of the diagram through all heights of the atmosphere.
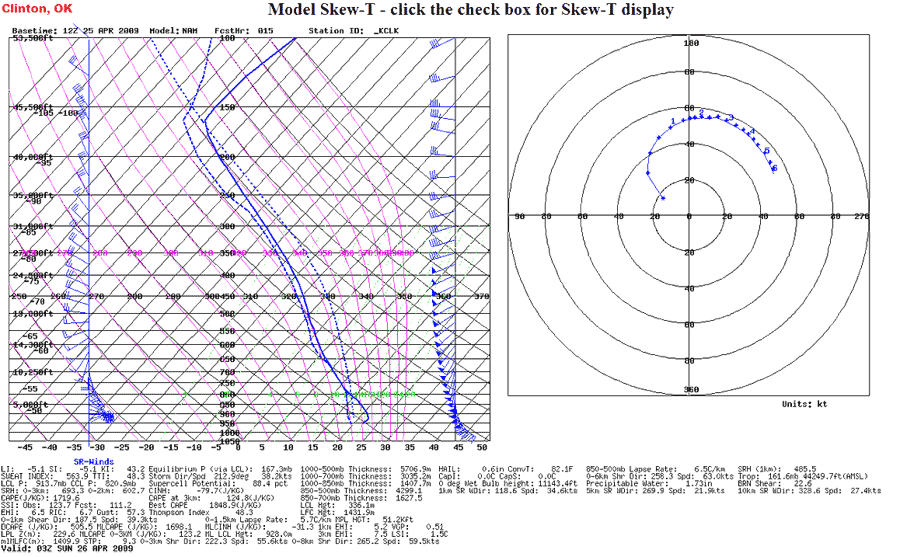
Tornadic plot from forecasting (NAM) model on Skew-T Diagram with Hodograph (right).
We give a wonderful workshop during our tours when time permits that explain the Skew-T diagram, however for this article, the subject is too vast to cover.
What we will cover in this article are some of the severe weather parameters that we can get from plotting temperature and dew point temperature through all layers of the atmosphere on the Skew-T diagram.
You may wish to print this page and bring it on the storm chasing tours with you so you can quickly find referencing definitions for the various forecasting terms you hear while storm chasing.
Lifted Condensation Level (LCL)
This is the level at which a lifted parcel becomes saturated, and is a reasonable estimate of cloud base height when air parcels experience forced ascent.
Level of Free Convection (LFC)
This is the level at which a lifted parcel begins a free acceleration upward to the equilibrium level. Research shows that tornadoes become more likely with supercells when LFC heights are less than 2,000 m above ground level, and thunderstorms are more easily initiated and maintained when LFC heights are lower than about 3,000 m.
LFC-LCL
The height difference between the LFC and the LCL. The smaller the difference between these parameters indicates that deep convection is more likely.
Equilibrium Level (EL)
The level at which a lifted parcel becomes cooler than the environmental temperature and is no longer buoyant. The EL is used to primarily estimate the height of a thunderstorm’s anvil.
Lapse Rates
The rate of temperature change with height. The faster temperature decreases with height, the steeper the lapse rate and more unstable the atmosphere becomes.
Convective Available Potential Energy (CAPE)
This is a measure of instability through the depth of the atmosphere, and is related to updraft strength in thunderstorms. It is measured as joules per kilograms (J/kg). Weak instability is CAPE less than 1000 J/kg. Moderate instability is 1000-2500 J/kg. Strong instability is 2500-4000 J/kg and extreme instability is CAPE greater than 4000 J/kg. In order tornadoes to from supercells in the central and southern plains, we typically need CAPE of at least 1500 J/kg.
Lifted Index (LI)
The temperature difference between the 500 mb temperature and the temperature of a parcel lifted to 500 mb. Negative values indicated unstable conditions. LI is more of a measure of actual instability than CAPE because it represents the potential buoyancy of a parcel at a level, whereas CAPE is integrated through the depth of the troposphere.
Normalized CAPE
CAPE divided by the depth of the layer where CAPE is present. Normalized CAPE can be interpreted in much the same way as the LI.
Convective Inhibition (CIN)
Represents the “negative” area on a sounding (plotted on a Skew-T diagram) that must be overcome for storm initiation. This indicates the strength of the “cap,” which is a layer of warm air aloft that prevents a parcel from rising, thus preventing storm formation.
Downdraft CAPE (DCAPE)
This is usually used to estimate the potential strength of rain-cooled downdrafts with thunderstorm convection. Larger DCAPE values are associated with stronger downdrafts.
0-6 KM Shear
The change in wind from ground level to 6 kilometers above ground level. Thunderstorms tend to become more organized and persistent as vertical shear increases, while supercells are commonly associated with vertical shear values of 35-40 kt and greater through this depth.
Effective Bulk Shear
The maximum bulk shear from the most unstable lifted parcel-level upward to 40-60% of the equilibrium level height. This parameter is similar to the 0-6 km bulk shear, though it accounts for storm depth (LPL to EL) and is designed to identify both surface-based and elevated supercell environments. Supercells become more probable as the effective bulk shear increases through the range of 25-40 kt and greater.
Bulk Richardson Number (BRN) Shear
This is similar to the 0-6 km shear, except that BRN shear uses a difference between the low-level win and a density-weighted mean wind through the mid-levels. Values of 35-40 m2s-2 or greater have been associated with supercell thunderstorms.
Storm-Relative Winds (SR)
A possible discriminator between tornadic and non-tornadic supercells.
Storm Relative Helicity (SRH)
A measure of the potential for cyclonic updraft rotation in right-moving supercells, and is calculated for the lowest 1 and 3 km layers above ground level. There is no clear threshold value for the SRH when forecasting supercells, since the formation of supercells appears to be related more strongly to the deeper layer vertical shear. However larger values of 0-3 km SRH and 0-1 KM SRH do suggest an increased threat of tornadoes with supercells.