
Global Forecast System (GFS)
The GFS has a time interval of 6-hours and forecasts out to 192-hours. It is most commonly used to forecast weather over a longer forecast period, such as one week. If the forecaster wanted to get a “general idea” of what to expect in a week’s time, s/he would use the GFS model to make their predictions, or since we’re looking at such an extended forecast period, we’ll call it an assumption.
This is because the forecast details will change and likely in great detail between now and one-week, however, the GFS output can at least provide us with enough information to know if we should be expecting any major changes in the upcoming week, such as a low-pressure system moving into the area. On the short-term, the GFS can be highly accurate and should not be overlooked when preparing a daily forecast. The GFS outputs new data sets (runs) in 12-hour intervals, respectively 00Z and 12Z.
North American Mesoscale Forecast System (NAM)
The NAM has a time interval of 3-hours and forecasts out to 84-hours. It is a medium-range model that is run every 6-hours (four times daily) at 00z, 06z, 12z and 18z. While the NAM can be a great tool to use to forecast the short-term, its very useful as a tool to help plan for tomorrow’s forecast.
When storm chasing, it is sometimes important to think one or two days ahead. Let’s say you’re the forecaster and after looking at all the data you identify two target areas with equal chances of severe weather, however, they are 1,000 miles apart from one another. After looking at the NAM for information about what may happen tomorrow, you realize that there will be only one target area and it’s roughly in the same location, give or take a few hundred miles, of one of today’s target areas.
You would then most likely want to chase in the area where you’ll have two chances of severe weather in two days, as opposed to the other target area where no storms are likely to happen tomorrow. That is of course unless today’s further target area has really bigger severe parameters. Then you might make the decision to play the further area today for more likely chances of a storm this evening knowing that you’ll be sitting tomorrow out.
Rapid Refresh Models
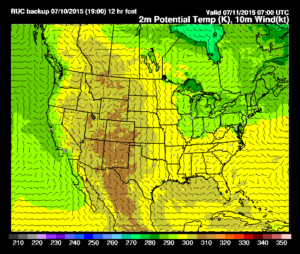
These models are the shortest forecasted runs of the three basic models. They (at the time of this writing) generally forecast out to 18-hours and produce new runs hourly.
As a forecaster, you would use this model to validate your earlier forecast throughout the day as you get closer to the time of the forecasted event. These models are usually the most accurate since they’re created using the freshest data.
This is where all that information from commercial airplanes and surface observation reporting stations comes into play. This data is constantly being inputted into these short-term rapid refresh models and creating a new forecast. Remember that butterfly flapping its wings?
Once the result of that has occurred it is recorded by a weather station and given to a supercomputer that crunches a new output model.
The drawback to these models, from a storm chaser’s point-of-view, is that you likely need to use other pieces of information in order to make a forecast that will require a road trip over great distances.
If you wait until the last minute for the rapid refresh model to tell you that your area of interest is 300 miles away and will happen in two hours, you’ve missed the event! The skilled forecaster, on the other hand, would have used various models to make an accurate forecast well ahead of time to allow for the road trip, and then have used the rapid refresh model to make adjustments to their forecast throughout the day as needed.
Mixing Things Up
A skilled forecaster will pay painstaking attention to the differences of all these numerical models and validate which models are the most accurate. Quite often, one model may be more accurate on forecasting the temperature of moisture (dewpoint) while a different model is more accurate on forecasting the position of upper-level systems. Thus, the forecaster must take this information into consideration when interpreting the data and planning their target areas.
Summary
As you can see, a lot of information and variables go into making any weather prediction, especially when forecasting target areas of severe activity. And, once again (it can’t be stressed enough), since the atmosphere is fluidic and in a constant-state-of-motion, so must be the forecaster’s decision-making process. Forecasting models and methodologies have come a long way in recent years. The models are getting better because the computers that make the models are getting faster.
It’s a good idea to familiarize yourself with some of the Severe Weather Parameters that we’ll be using during your storm chasing tour(s).
We cover a great deal of information about severe storm forecasting during our storm chasing tours and we do our best to make the learning process fun. We have many great tour options to choose from ranging from shorter 6-day storm chasing tours to longer 10-day storm chasing tours. To get started, simply visit our tour schedule and make a reservation.
View the Storm Chasing Tour Schedule