
Obtaining Weather Measurements
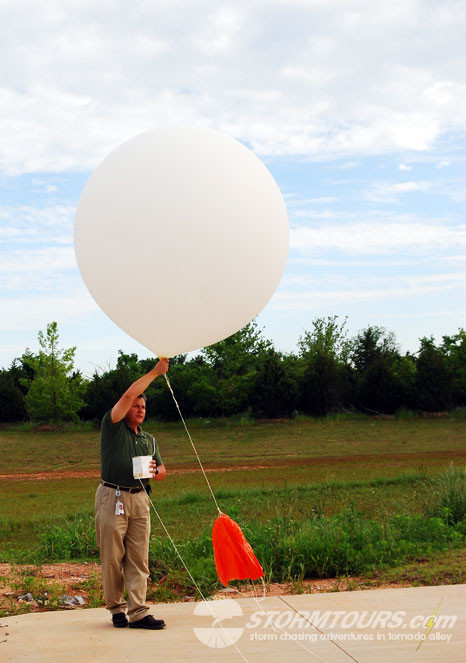
Twice each day, forecasters launch weather balloons from thousands of locations around the globe. As the balloon rises through the atmosphere, it collects a wealth of information. A device called a radiosonde measures temperature, moisture temperature (dew point), pressure, wind speed and direction through each layer. It then transmits that information via radio back to a ground station.
In addition to information collected from weather balloons, forecasters also receive such data from commercial air traffic.
As a commercial plane travels through the air it is collecting weather information about the atmosphere around it. As a result, weather data processing centers receive these data in near real-time. Such processing centers use the information to create, in some cases, hourly forecast models. Further, ships and buoys also transmit data included in forecast models.
Aside from data collected from balloons, planes, ships, and buoys, forecasting models include a variety of other factors. Forecasting models also use data such as reflection and absorption of solar and infrared radiation, for example.
Outputting Numerical Models
In the USA, the information is sent to the National Centers for Environmental Prediction (NCEP), which is part of the National Weather Service. Several other countries have a similar office where weather data from their radiosonde launches are sent to as well.
All of this collected information is inputted into supercomputers where the data is crunched using very complex equations to describe how the atmosphere changes at every point on a three-dimensional grid.
Once these supercomputers calculate all the data, it outputs the numerical information which can be plotted on a paper map. This is called a “numerical weather forecast model,” or just a “model” for short.
Typically, there is one map for each layer of the atmosphere. When these maps are layered on top of each other, it creates a 3D picture of the state-of-the-atmosphere and predicts what it thinks will happen over a period of time-based on a set of time intervals. Those intervals, for some models, can be as little as 1-hour and for other models, they are 3-hours, 6-hours or 12-hours.
Once we have obtained all the data needed to make a weather forecast we have to be able to read and understand the data There are two main ways to do this, the first is through a Skew-T Diagram and the other is through various plots that show a single layer of the atmosphere called a numerical model.
Next, let’s look at how forecasters interpret the weather data.